
Table of Contents
Introduction
Since late 2020, I have been developing software named OpenAthena™ which introduces a novel terrain-raycast software technique for remote sensing by UAS (drones).
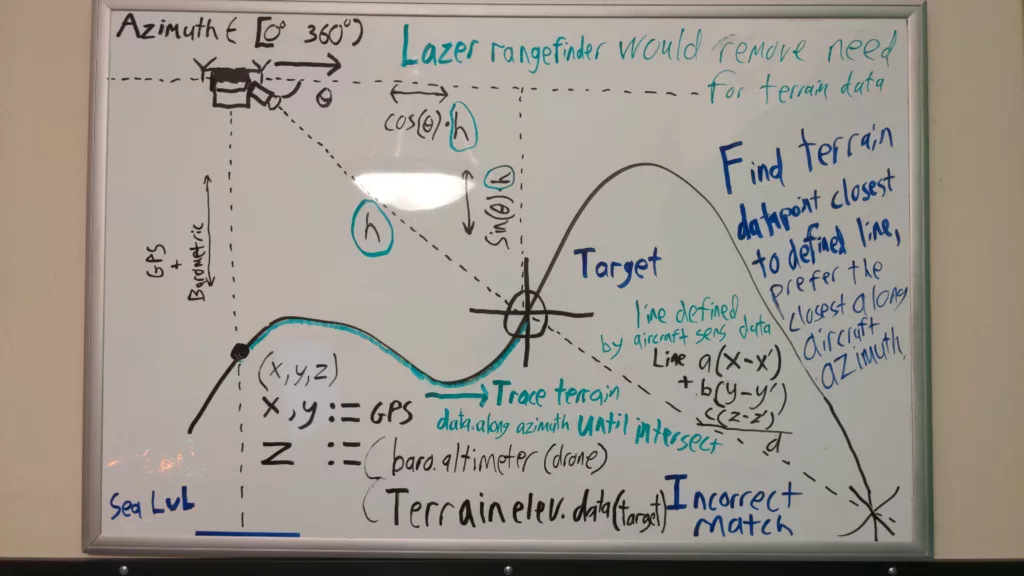
It all started from humble beginnings as a hair-brained idea on a whiteboard:
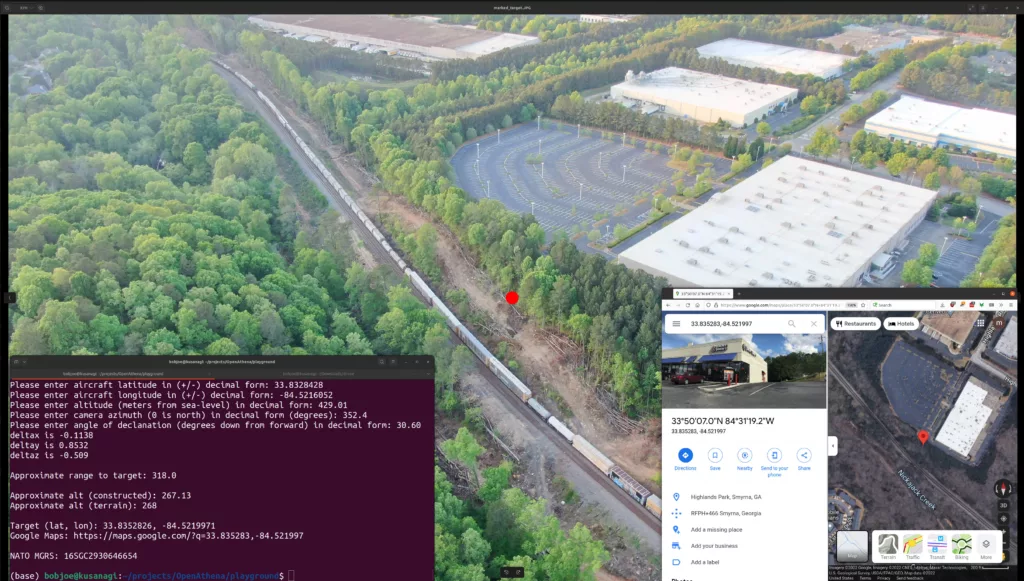
In May, June, and July of 2022 I completed a successful implementation and proof of concept for the new technique:
Following the successful prototype in 2022, I founded the company Theta Informatics LLC in August 2023. In the time since (to December 2024), my co-founder (my father Dr. Robert Krupczak) and I have:
- re-written the software in Android Java and as a standalone Java library
- added functionality to calculate any arbitrary image pixel (not just center) using camera intrinsics modeling with a database of parameters for over 50 drone models
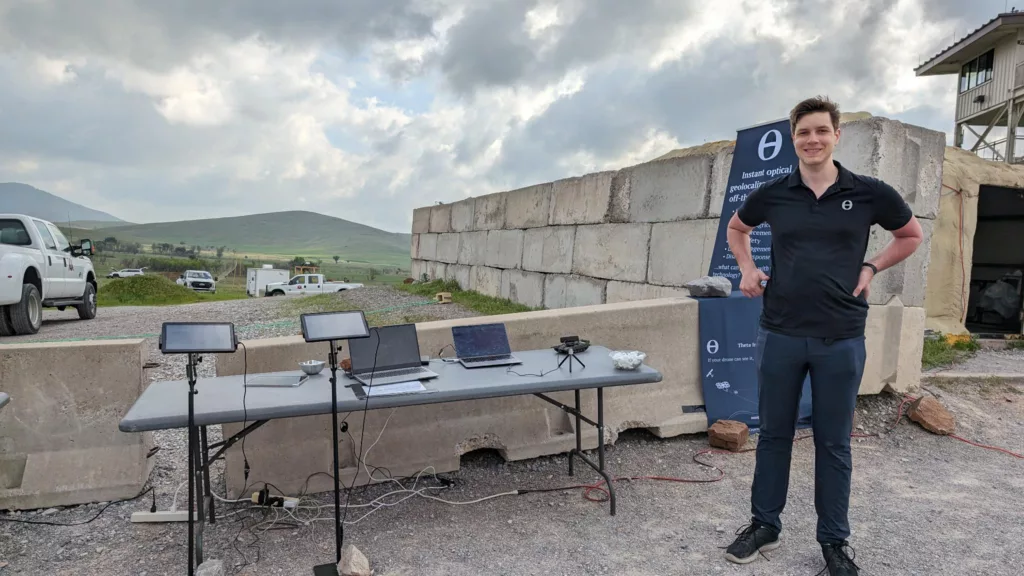
- various field testing and empirical accuracy studies including private tests, participation in exercise at U.S. Army Fort Sill, JIFX 24-3 at the Naval Post Graduate school, and demonstration and testing at OUSD (R&E) I&M’s Thunderstorm 24-2 event to Army 2-13th aviation regiment and others
- Participation in Army Applications Laboratory VERTEX event and Army Capabilities Manager UAS industry day
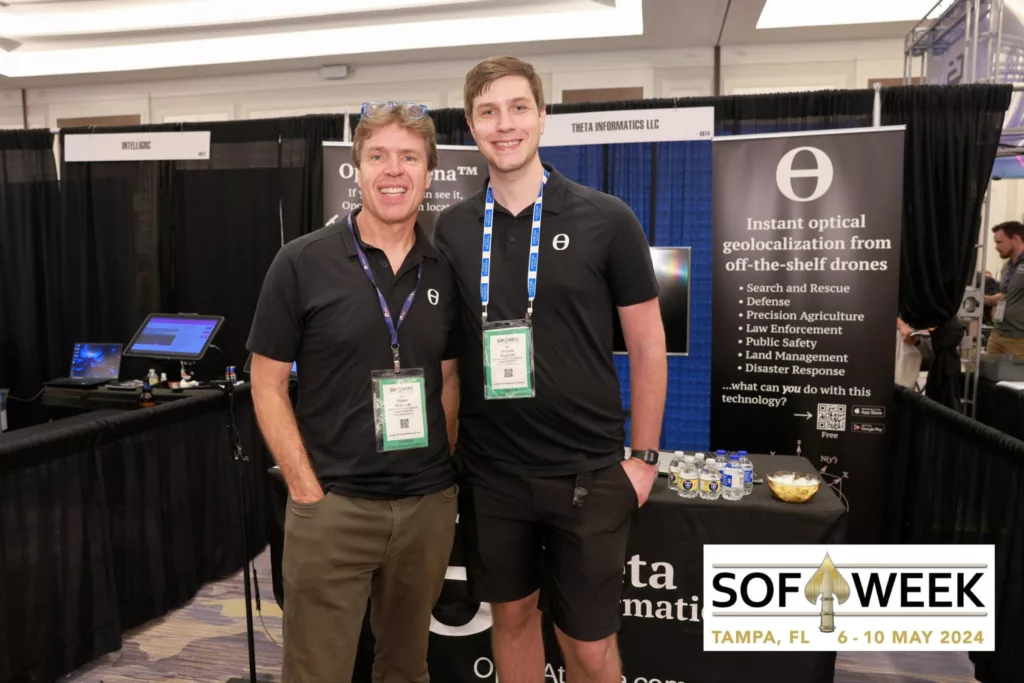
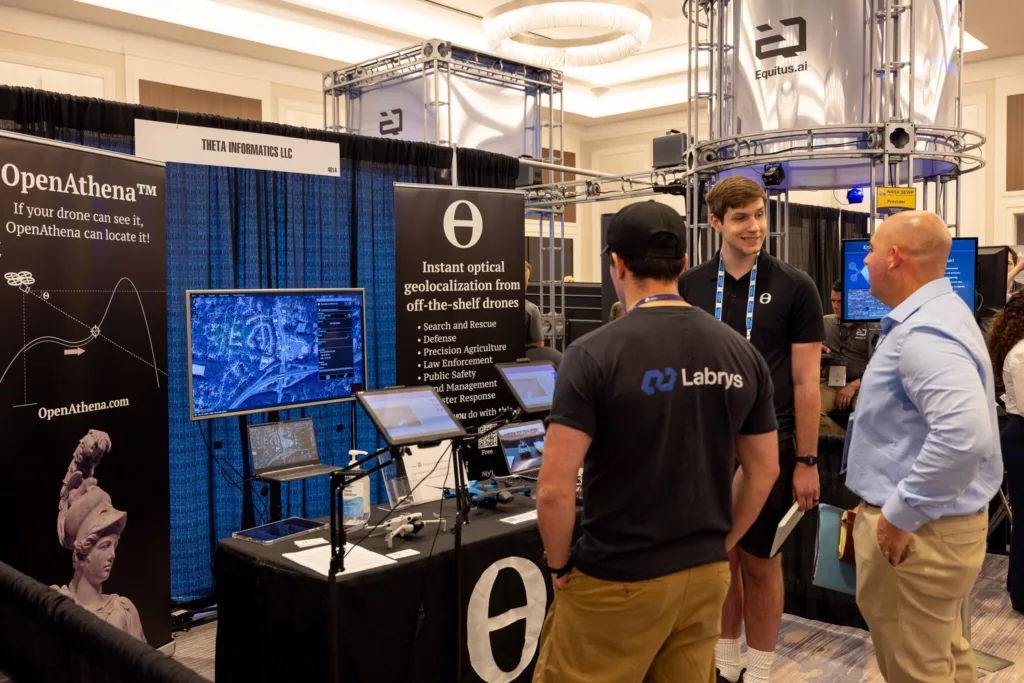
- running an exhibit with an interactive software demo of OpenAthena for Android’s integration with ATAK at SOF Week 2024 in Tampa, FL
- independent testing by a unit in the USMC with their own drone hardware
- addition of accuracy improvements including vertical datum conversion and inverse distance weighting interpolation
- trained state-of-the-art object detection AI models for identification of military objects for future integration with the software
- selected as one of 29 companies out of 139 applicants to present for INDOPACOM, US Army Pacific, Marine Corps Warfighting Laboratory, and representatives from the Office of Naval Research, NIWC, AFRL, DARPA, SpaceWerx, DHS, CBP, and more
- First Beta release of the software with addition of new AutoDEM feature which automatically downloads and loads elevation data for the area around a drone without user intervention.
- Completion and distribution to customers of OpenAthena Core, a licensed product making the same capability available to UAS manufacturers as a software library or microservice


It has come to the point in this technology and my firm’s development that we seek to share our methodology, study, and results of the OpenAthena software’s novel terrain-raycast remote sensing technique.
The reasons for this effort are two-fold: first is the lack of comparable study in available scientific literature for remote sensing (the closest similar study is of a technique known as geo-referencing). Secondly, the availability of this class of technology (and its usage in the Ukraine war with Dima Kovalenko’s FireFly plugin for Kropyva) has important implications for necessary development of new training, tactics, and procedure (TTP’s).
Armed forces that protect free societies need new TTP’s to prepare both for and against use of this technology to be ready for future Large Scale Combat Operations (LSCO). This becomes especially important considering how prolific UAS (unmanned aerial systems, aka “drones”) have become in current conflict and their demonstrated effectiveness for the Forward Observer (FO) role operating in concert with traditional combined arms forces such as armor, infantry, and artillery.
Despite the demonstrated performance, efficacy, and surprisingly-disruptive effect of terrain-raycast technology from UAS, few understand it, are aware of it, or even know it’s possible in the first place. This is principally what this publication seeks to resolve.
Experiment Setup for Empirical Accuracy Assessment
Our early testing of the OpenAthena software was mostly qualitative, not quantitative. That is to say, we would make changes to the software, mark image points within the app, and only subjectively-evaluate the accuracy of where the points generated by terrain-raycast landed on a map.
While this provided useful feedback necessary for rapid iterations on the OpenAthena software’s terrain-raycast engine, it hardly provided any scientific rigor. For this reason, we developed an experiment methodology and automated framework for empirical accuracy analysis. It works by comparing terrain-raycast calculation output from the OpenAthena software to the location of known Ground Control Points (GCPs) recorded using a survey-grade RTK GPS instrument.
The first step in the experiment is to place markers for and record the location of ground control points which will be visible within later drone imagery.
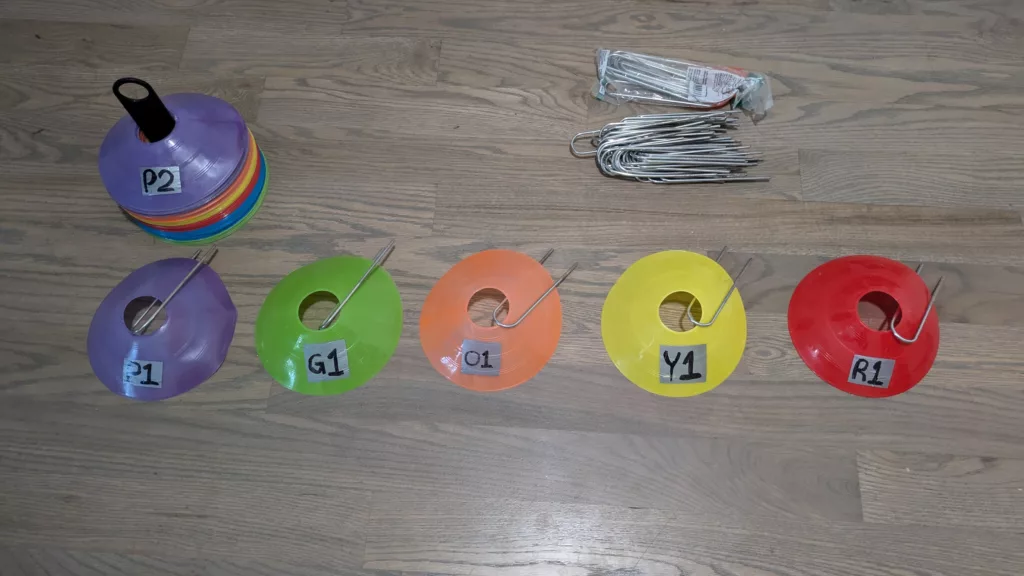
For the GCP markers, we’ve been using plastic disc cones (commonly used for practice in soccer [for non-U.S. persons: football]), which are convenient to transport, place, and mark by hand to later observe from the air by drone:

We label each cone with a letter and sequential number according to their color (e.g. ‘o1’ for an orange cone). When placed for an experiment, we stake them into the ground using galvanized steel stakes (designed for anchoring irrigation tubing to soil, available inexpensively from any hardware store).
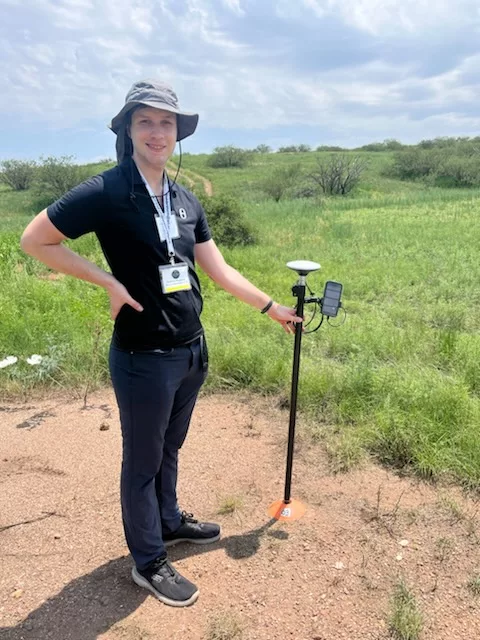
After placement, the location of each GCP is recorded using our RTK Calibrated Surveyor Kit:
These recorded points are used in accuracy experiments as the absolute ground truth, so the 3-5 meters accuracy of a regular smartphone GPS is insufficient. Thankfully, external GPS receivers with Real-time kinematic positioning (RTK) accuracy enhancement have come down in price significantly over the past decade:

These receivers enhance the accuracy of existing GPS by measuring the phase of the incoming GPS signal’s carrier wave and comparing it against a stationary base station:
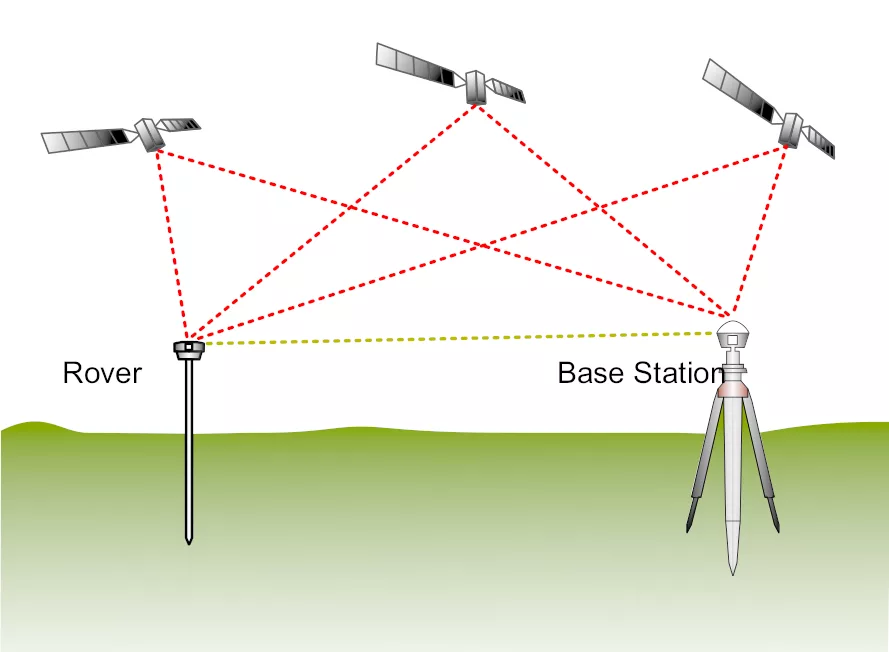
The stationary base station averages its measured GPS position over a period of up to 24 hours, which averages out the random error of GPS. The Rover RTK GPS receiver we used is then able to calculate its own position accurately in real time by communicating with the base station to compare the wave phase of the incoming GPS timing signals. This corrects for GPS error from factors such as atmospheric conditions which affect the propagation of GPS signals, providing greater accuracy than regular consumer GPS receivers.
For Theta’s experiments, we usually connect to a remote base station via the NTRIP network protocol to free base stations provided by the RTK2go.com service. This service has over 8,000 base stations from volunteer operators, with coverage of most of the continental U.S., Europe, and Japan:
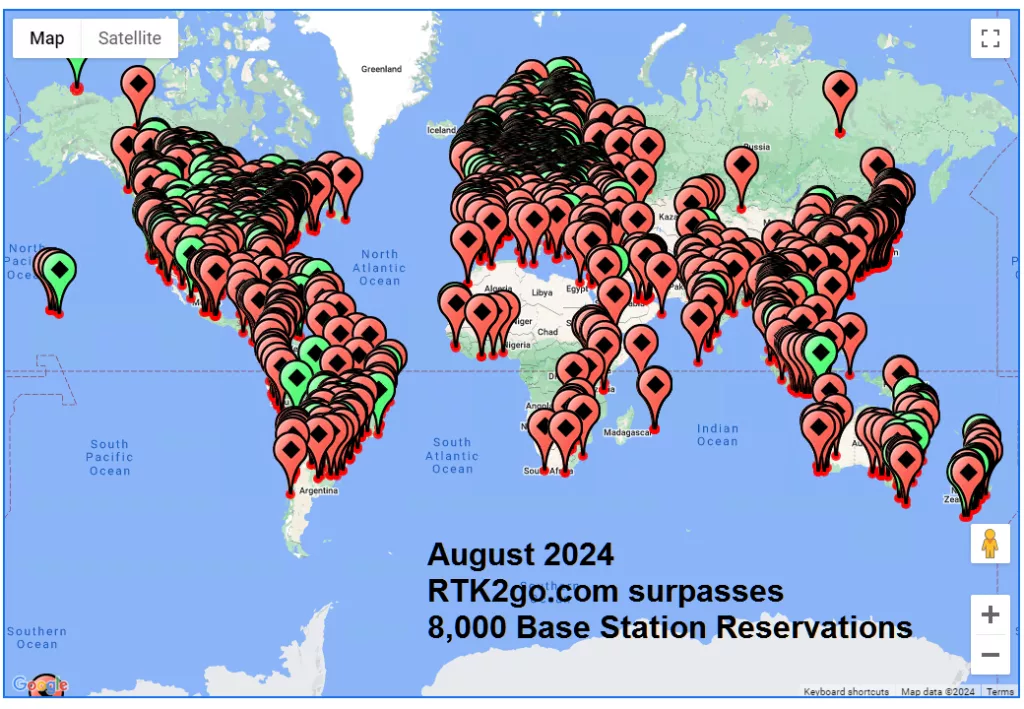
Distance to the closest available base station has some impact on RTK GPS accuracy. Whereas a base station within < 35 km range can provide sub-centimeter level accuracy, most of our experiments used base stations within 100-200 km range, providing horizontal accuracy around 4-8 centimeters. Given that location error from the OpenAthena software is typically within 2-10 meters, this error from RTK GPS with a remote base station is negligible for the purposes of experimentation.
East Roswell Test 01 Methodology
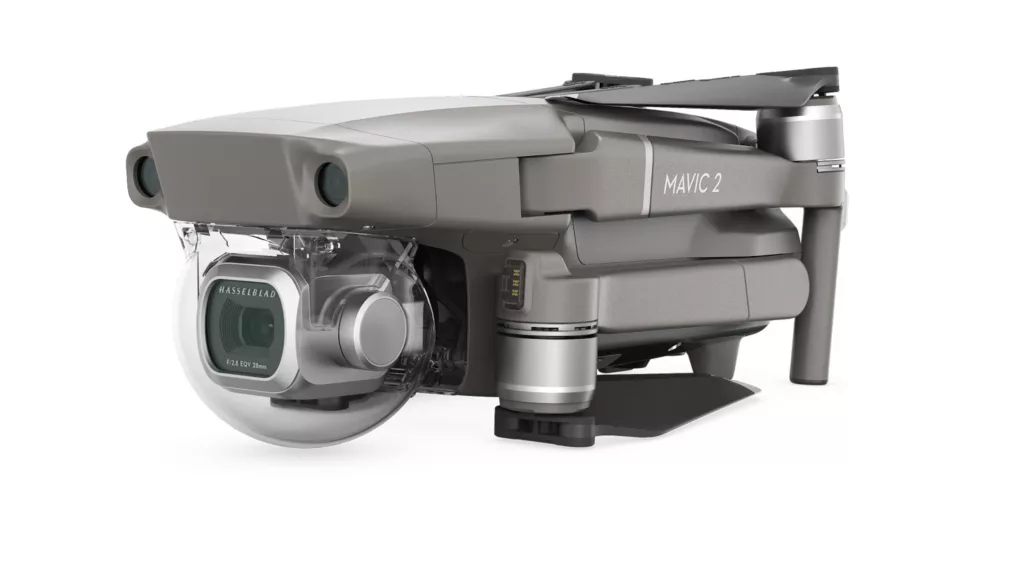
Our first accuracy test was conducted with a DJI Mavic 2 Zoom drone in East Roswell near Atlanta, GA.
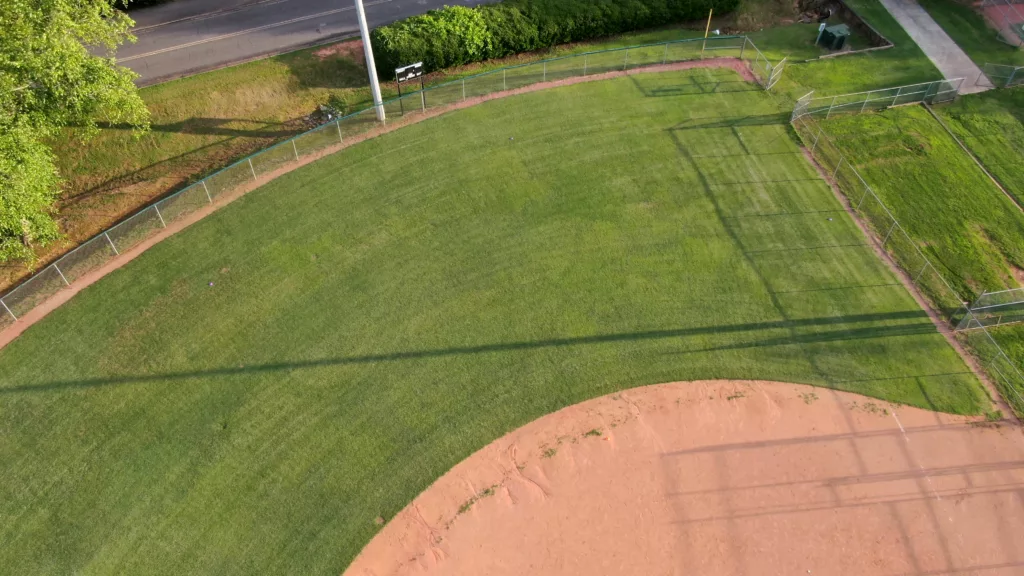
We placed seven GCPs around a baseball field and recorded them using the SW maps app on Android with the RTK Calibrated Surveyor Kit:
The GPS lat, lon, and elevation values of these GCP’s are exported from the SW Maps app as a comma-separated values (CSV) file for later use with our accuracy evaluation framework.
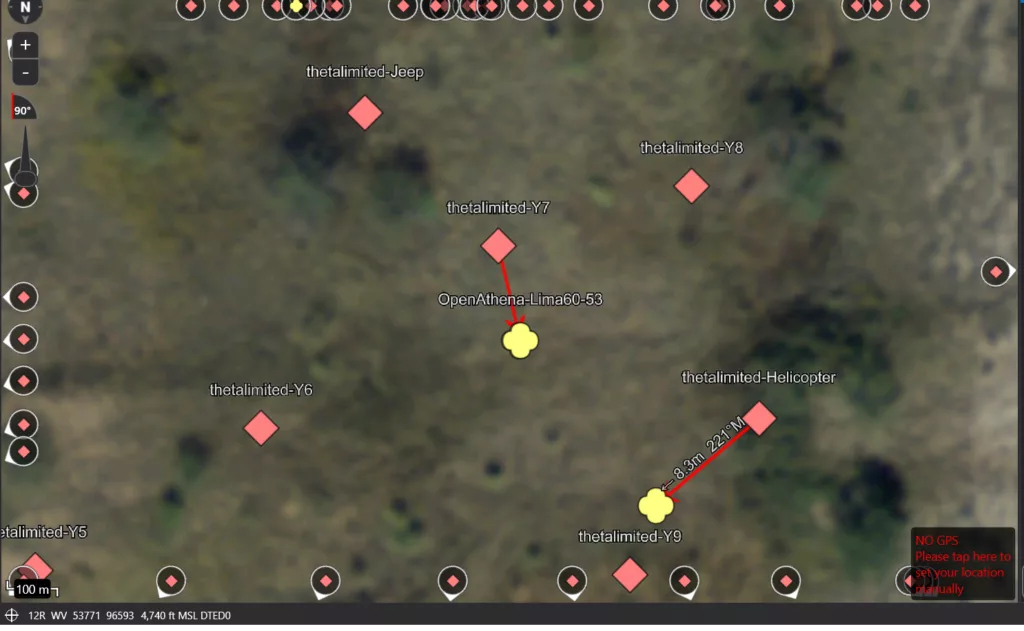
Next, we flew the drone above the baseball field and took pictures of the GCPs from a variety of altitudes, horizontal distance, and camera slant angles:
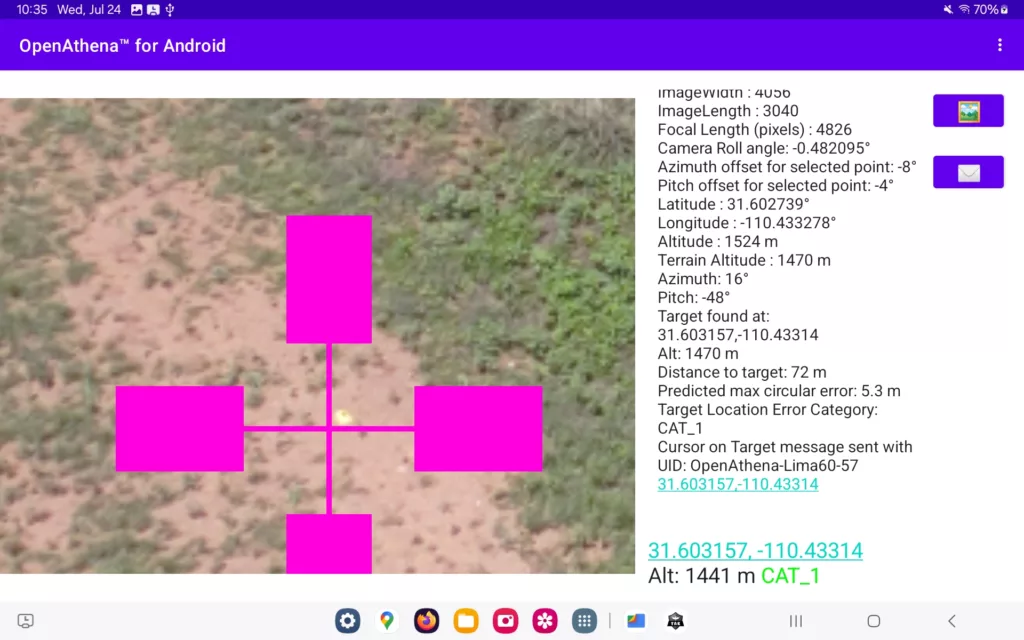
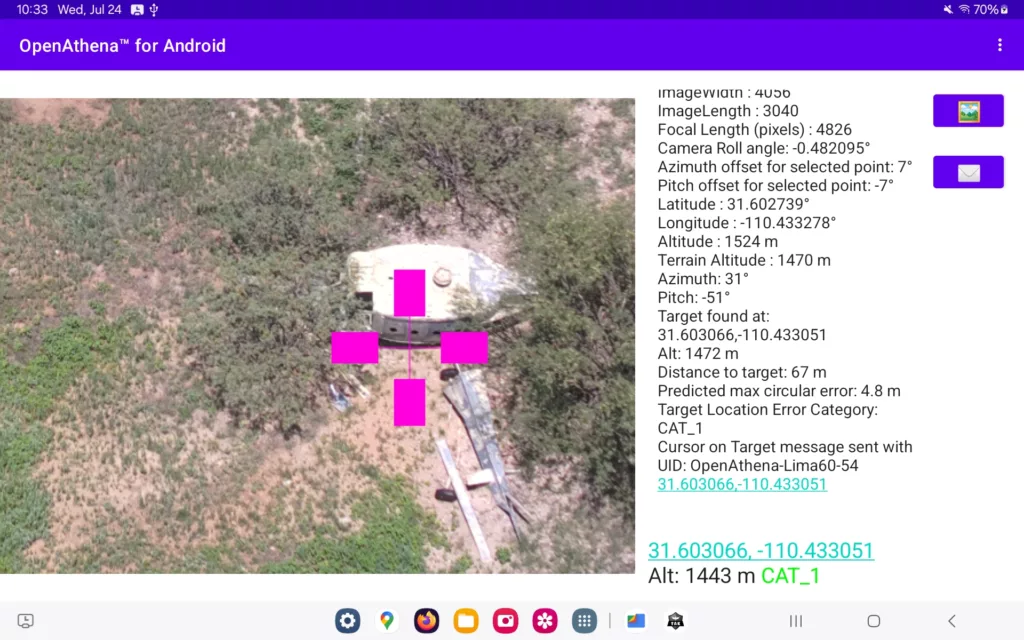
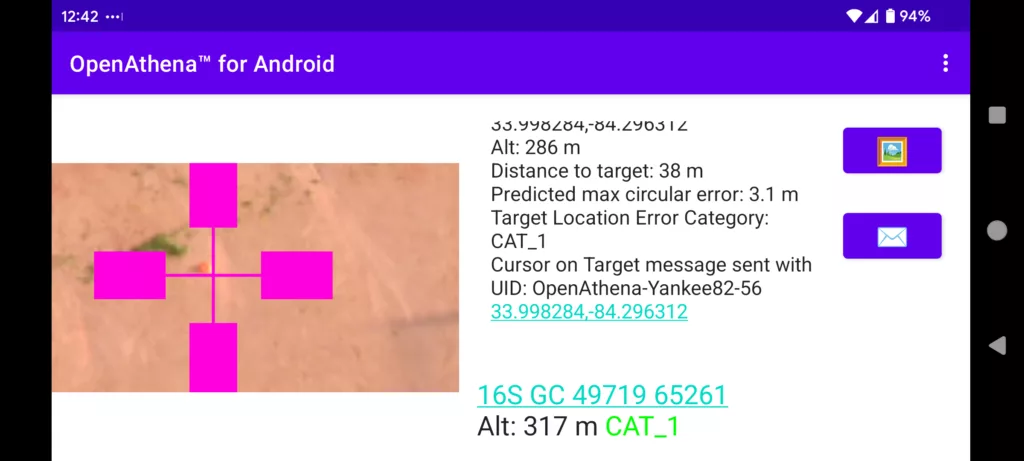
The plastic disc cone markers for GCPs are incredibly subtle from the full-sized image but are fairly easy to spot and mark from OpenAthena when zoomed in:
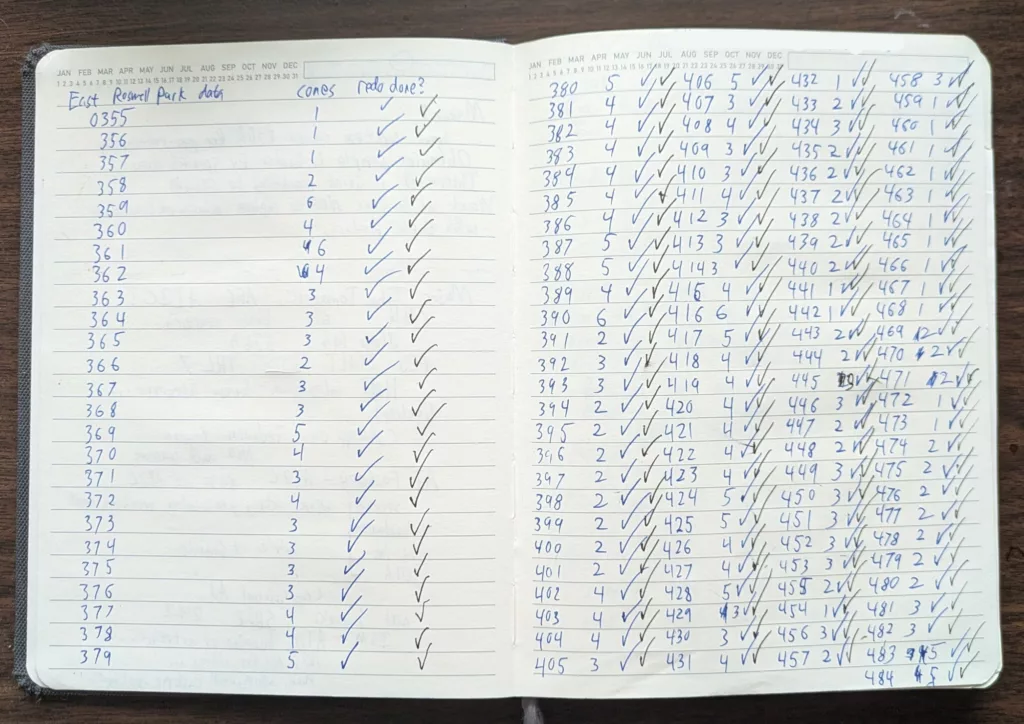
For this experiment, 131 images were recorded with 1-6 GCPs visible at varying points within each image. A total of 381 calculations were recorded from OpenAthena’s Cursor on Target output for comparison against the recorded GCP locations.
A computer on the same local area network (LAN) ran the following script to record the Cursor on Target terrain-raycast calculation output from OpenAthena and dump it to a CSV file for later analysis:
Along with the latitude, longitude, and elevation from each calculation from OpenAthena, a variety of independent variables such as camera slant angle, drone-to-target (ray) slant angle, target x,y position within image, drone position, zoom level, etc. were recorded for later statistical analysis.
For this kind of experiment, it is desirable to evaluate a large number of calculations from OpenAthena. A larger sample size, obtained from many calculations, provides more useful accuracy statistics, greater statistical significance for the results, and better insight into which factors (i.e. independent variables) most influenced target calculation accuracy (the main dependent variable for this experiment).
Matching each calculation from OpenAthena to its corresponding GCP manually would be far too laborious for frequent performance of this kind of experiment. To save from this effort, we developed an automated framework in the R programming language which matches each calculation from OpenAthena to the nearest corresponding GCP. While an imperfect method, in practice mis-matching from target overshoot or undershoot error is minimal as long as there are not multiple GCP’s placed co-linear along the drone camera’s aim.
https://github.com/Theta-Limited/OA-Accuracy-Testing/blob/main/Analyze-OA-CoT-and-GCP-csv-data.R
East Roswell Test 01 Results
The main three statistics we use to evaluate OpenAthena’s accuracy with a given drone are Circular Error Probable (CEP), Circular Error 90th percentile range (CE90), and Mean Absolute Error (MAE).
CEP is a statistic commonly used to evaluate the precision of weapon systems since WWII. Put simply, it is the range at which 50% of events occur around the actual desired target (50th percentile of error range). Typically it is used to provide the range around a target within which a hit (e.g. from a bomb or artillery) is just as probable as a miss. Outside the military domain, it is also useful as a precision statistic for remote sensing. The CEP statistic, i.e. the median location error, provides a useful understanding of typical location accuracy of a given system.
CE90 is a similar statistic but which provides the range at which 90% of events occur around the target (90th percentile of error range). Compared to CEP, this statistic is far less tolerant of outliers and therefore provides a better measure of the edge of typical performance of a system. It omits only the most egregious, furthest 10%, of outliers.
Mean Absolute Error (MAE) is a statistic which represents the simple average (mean) location error of all events.
Compared to CEP and CE90, MAE is somewhat influenced by even the most egregious outliers. We use Mean Absolute Error (MAE) rather than Mean Squared Error (MSE) for evaluating a drone’s performance with OpenAthena because MSE is significantly skewed by infrequent large outliers. Experimental data shows that extreme outliers in horizontal location error occur for OpenAthena’s terrain-raycast technique when the slant angle from drone to target is less than 10° downward from horizontal. This typically limits the effective horizontal range of accurate results the terrain-raycast technique to roughly 5.5 times a drone’s above ground altitude. We educate users that calculations beyond this range are outside the expected effective range of the system (and present this information accordingly within the software’s interface), however for transparency such outliers are still included within the MAE figure for this kind of accuracy study.

Sample size: n=381 calculations from 131 images of multiple GCPs
| Accuracy Statistic | Description | Value |
| CEP | 50th percentile of Circular Error | 8.28 meters |
| CE90 | 90th percentile of Circular Error | 12.0 meters |
| MAE | Mean Absolute Error | 8.24 meters |
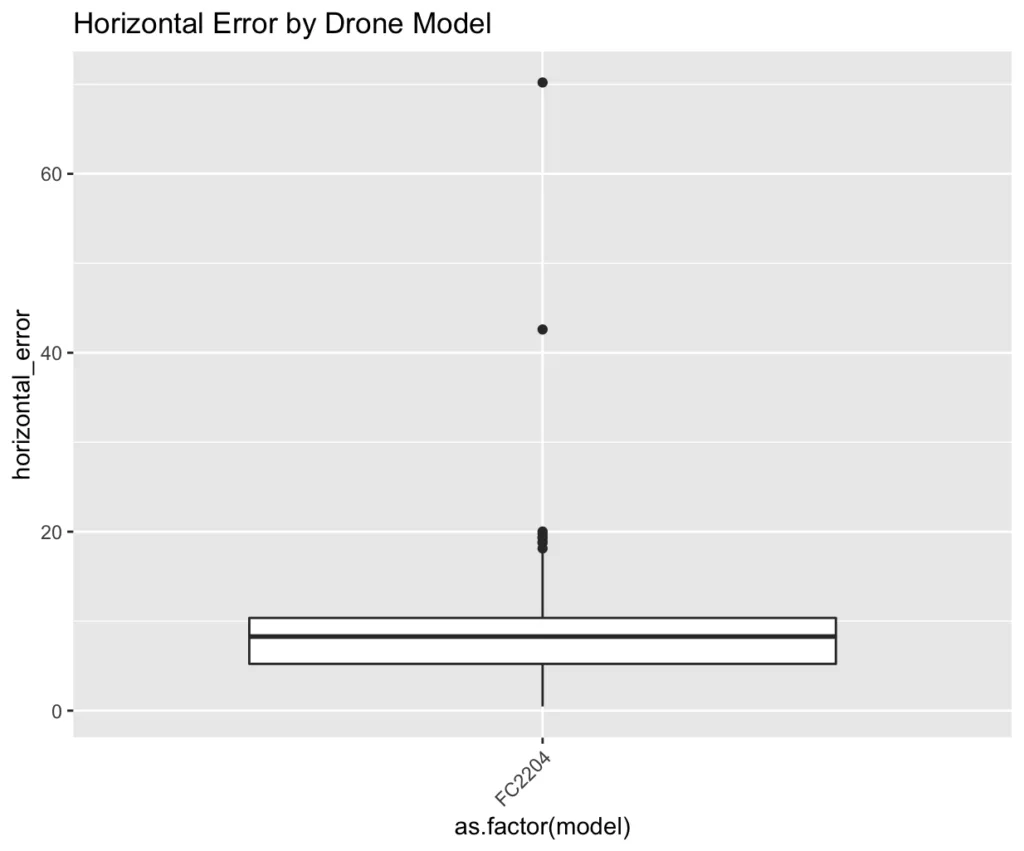
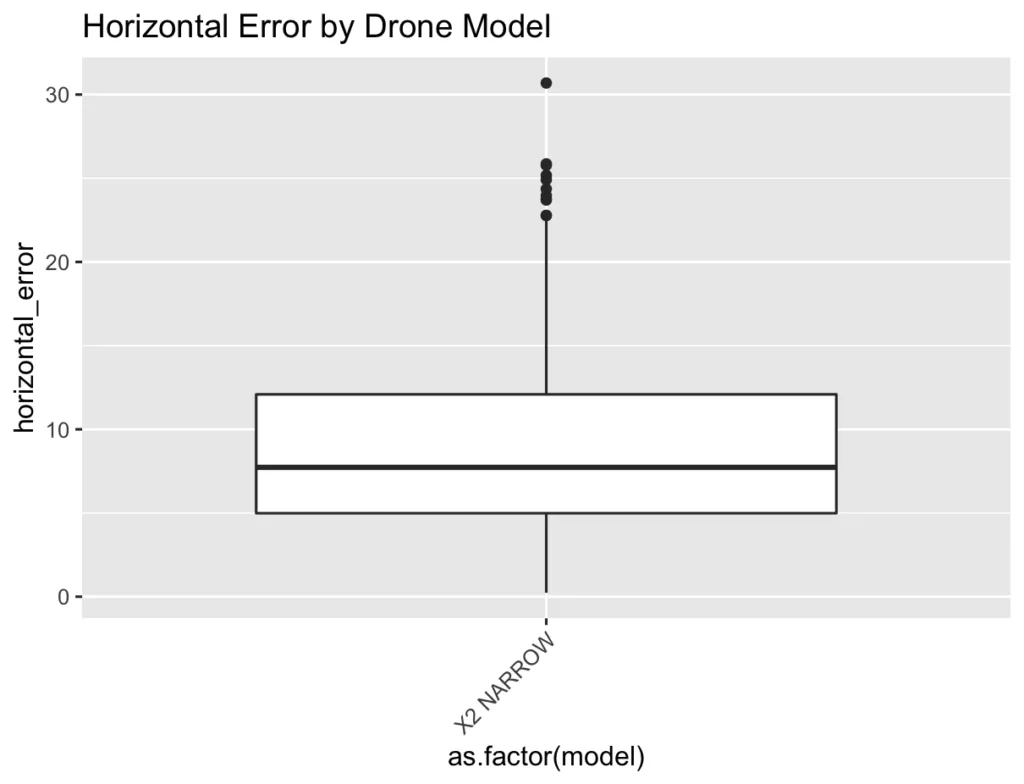
The following Box Plot shows the distribution of calculation horizontal error observed from the OpenAthena software in this test. The median (8.28 meters) is represented by the solid mid-line of the white box. The first standard deviation above and below the median (containing about 64% of all samples) is represented by the top and bottom of the white box. The second standard deviation (containing about 95% of all samples) is represented by the top and bottom of the black vertical line. Individual outliers beyond two standard deviations are represented by individual black dots:
As we can see from the following graph, the most significant outliers occurred only when the slant angle from drone to target was less than 10° downward from horizontal:

Such outliers occurred typically only when the drone was far away and nearly horizontal with the ground target:
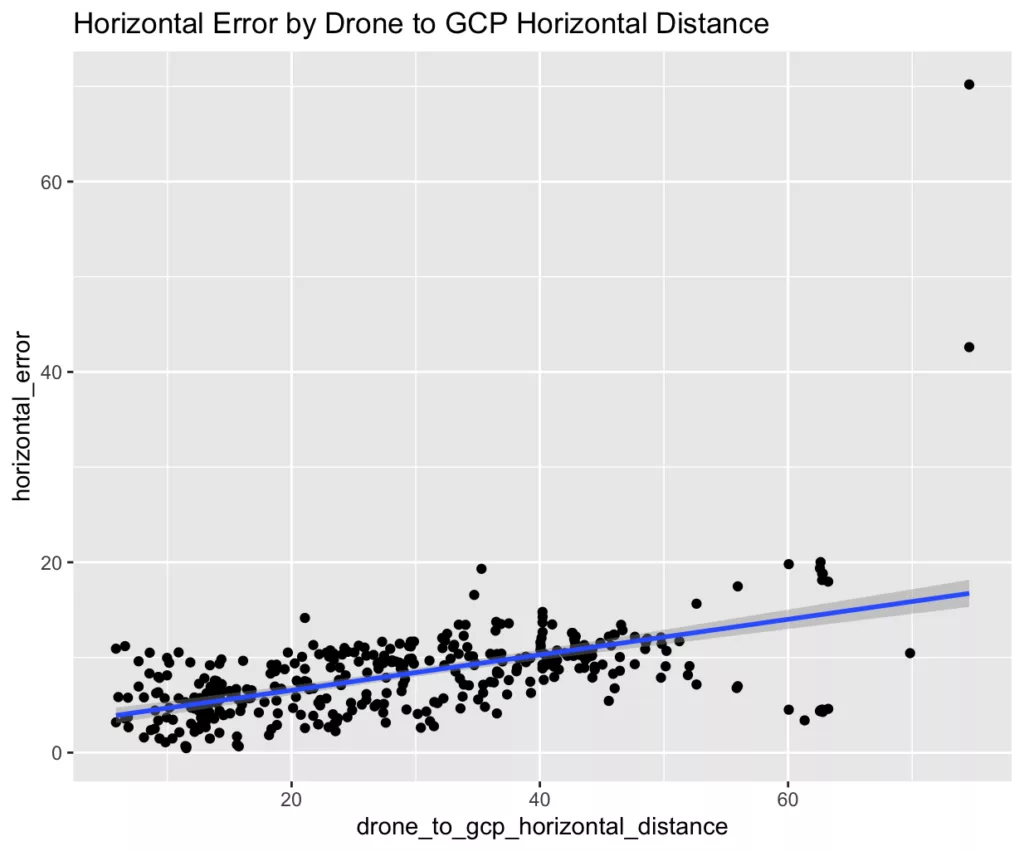
For the following graphs, these two outliers are removed for closer examination on the vast majority of experimental samples.
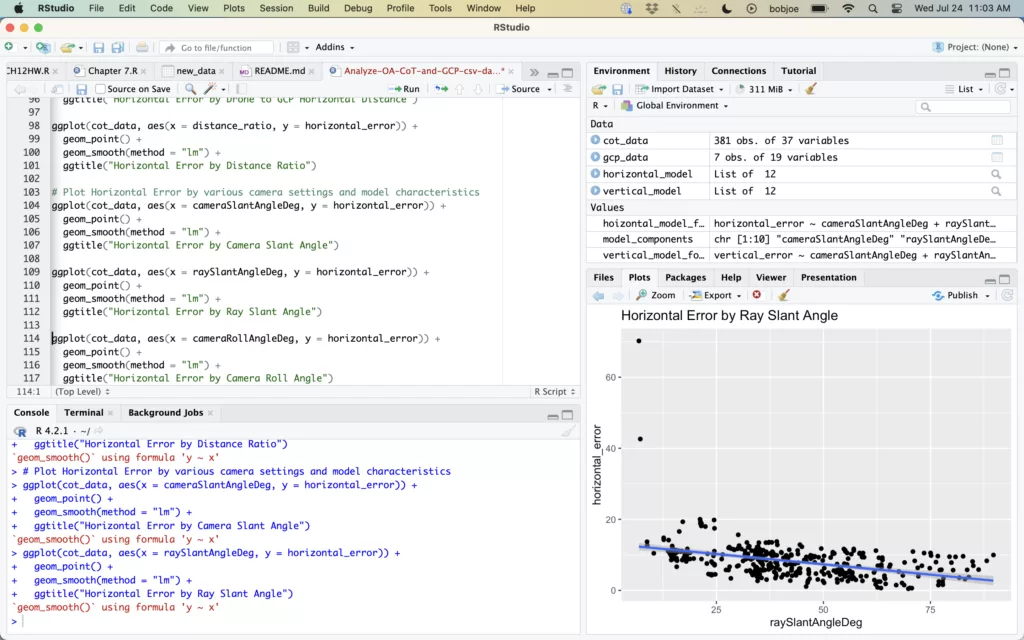
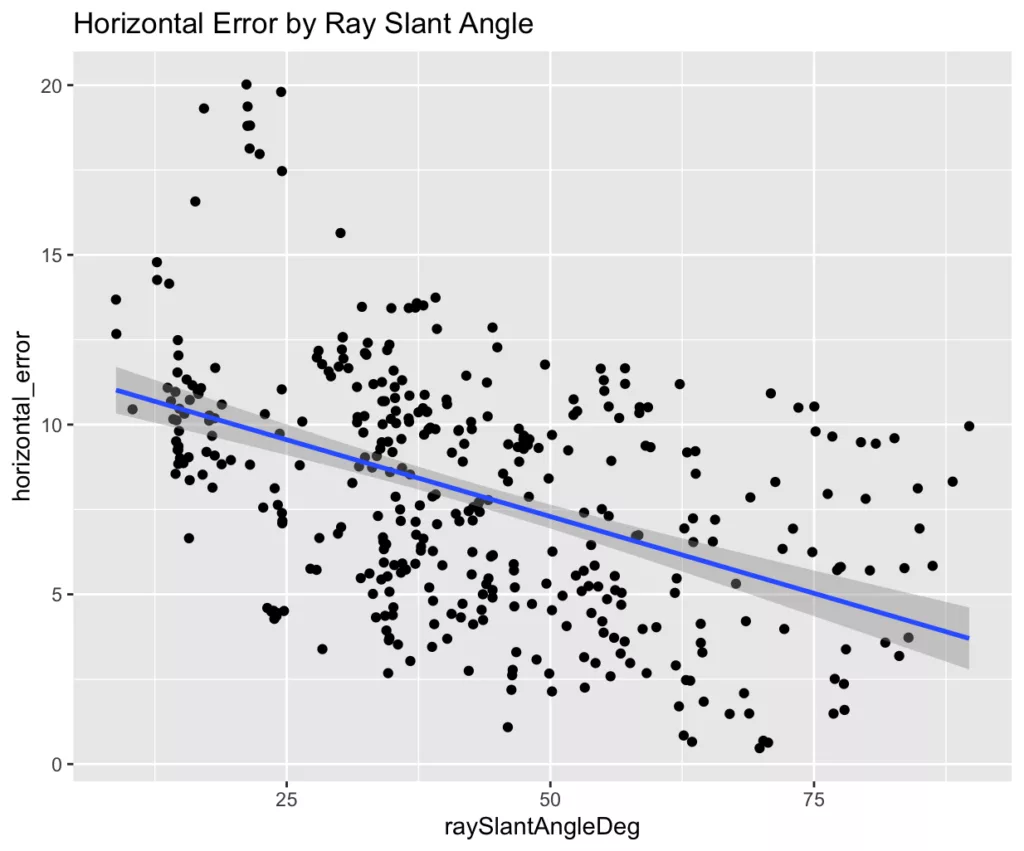
A graph of the horizontal error by ray slant angle shows that steeper slant angles from drone to target typically have greater accuracy:
A graph of the horizontal error by drone to target horizontal distance shows that horizontal error increases slightly in proportion with range:
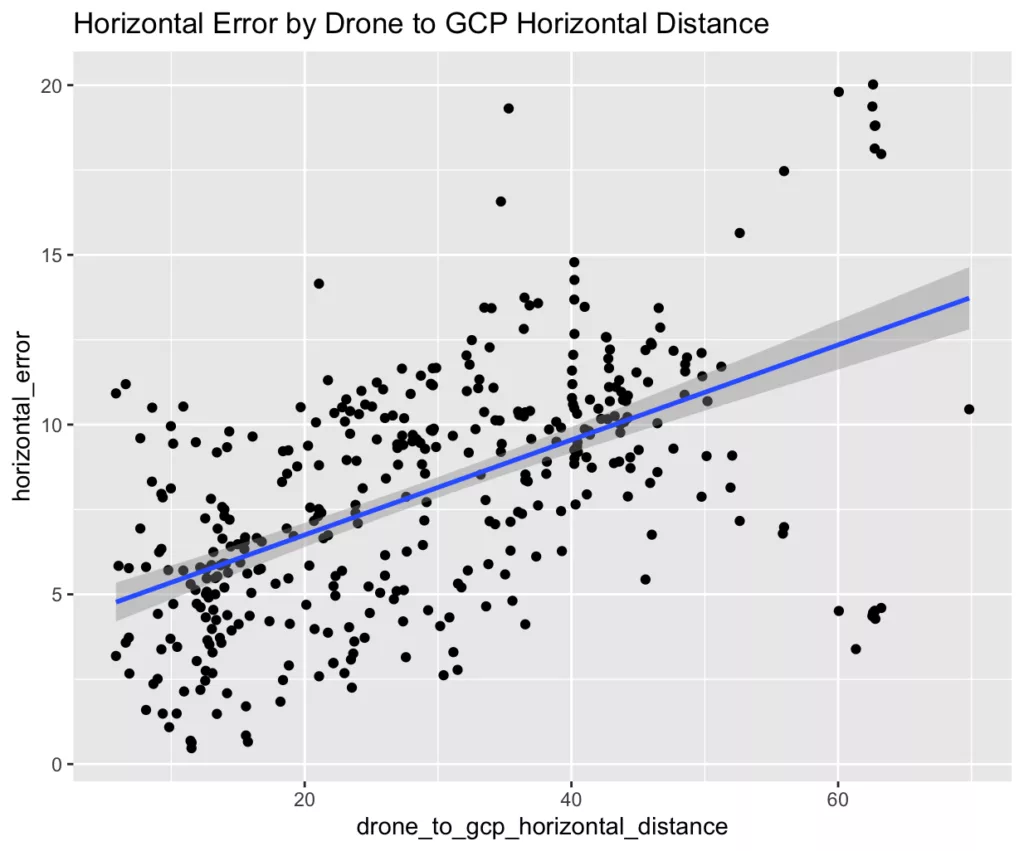
Intuitively, this may be understood as the effect of minor angle inaccuracy of the drone camera’s orientation. This effect would be expected to increase linearly with additional range similar to the figure above.
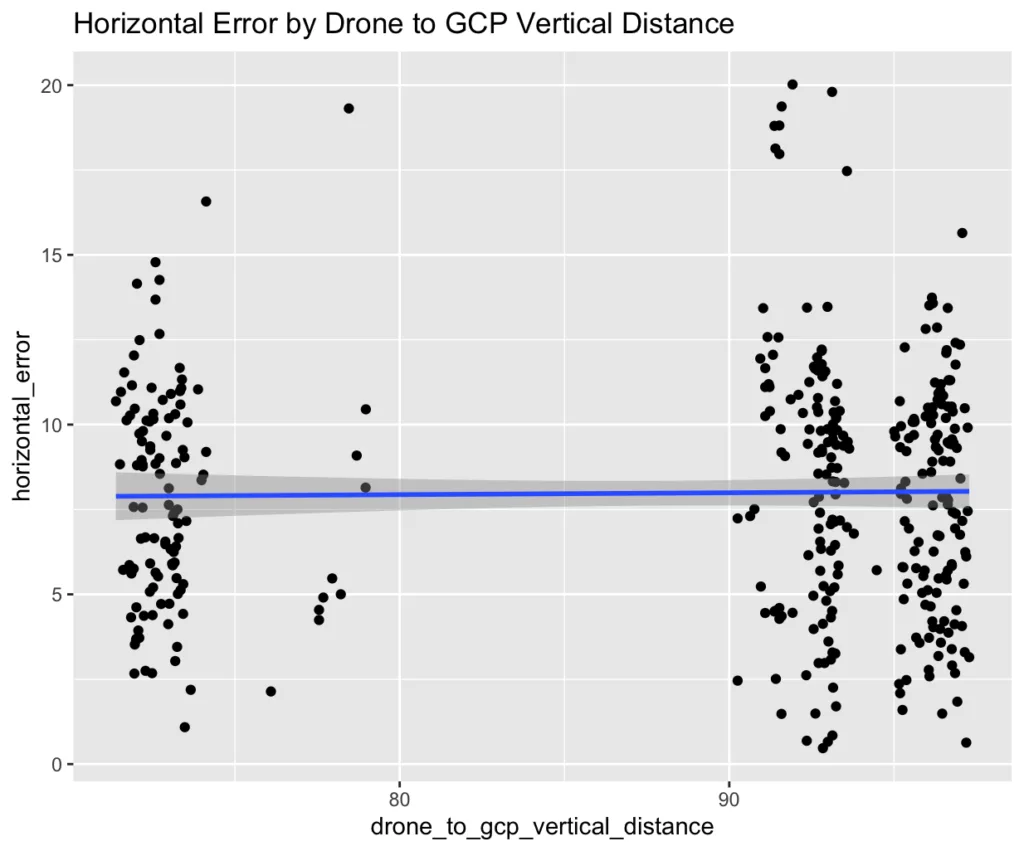
Vertical distance from drone to target had no discernible effect on accuracy:
Likewise, the position of each GCP within a drone image (measured as the distance in pixels from the center of the image [i.e. pixel distance from principal point]) had only a minimal effect on target accuracy in this experiment. This suggests that the camera intrinsics modeling used by the OpenAthena software for the DJI Mavic 2 Zoom‘s camera was mostly sound and provided relatively accurate pitch and yaw angle measurements for any off-center pixel within the visual field of an image:
The following is a linear regression model from R studio calculated from all independent variables recorded for this experiment to analyze the magnitude and statistical significance of each of their effects on calculation accuracy:
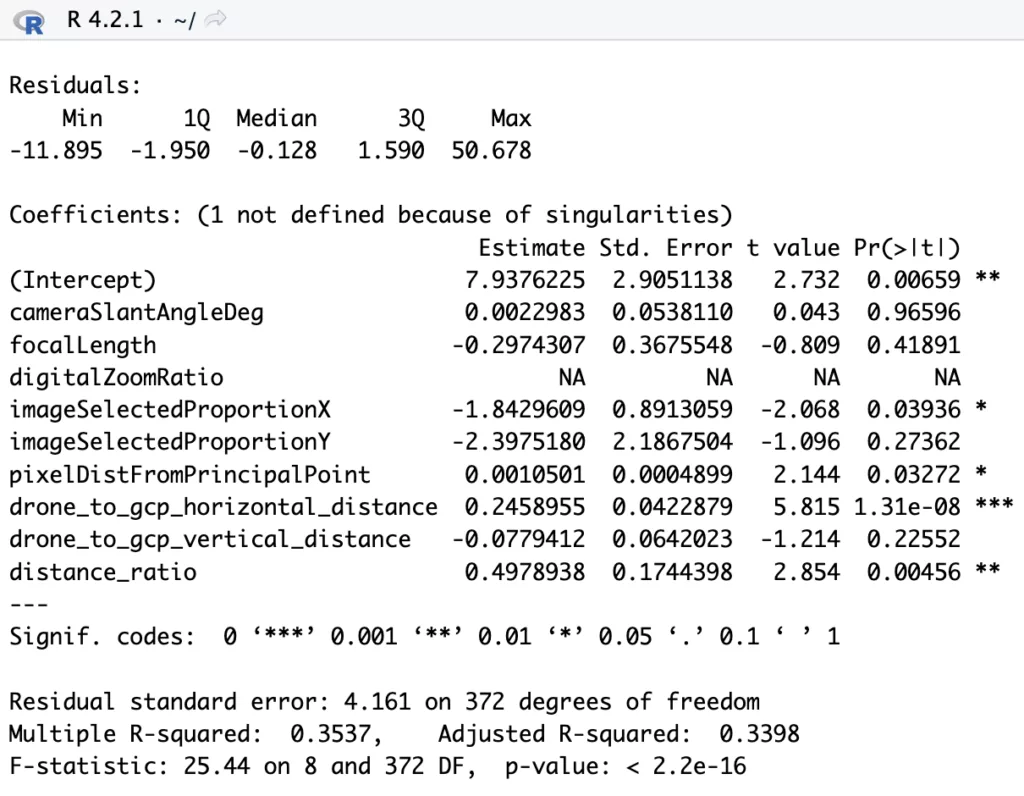
How to interpret these values:
Overall Model Fit:
- Residual standard error: 4.161 on 372 degrees of freedom.
- Multiple R-squared: 0.3537, meaning about 35.37% of the variance in the dependent variable is explained by the model’s independent variables.
- Adjusted R-squared: 0.3398, which accounts for the number of predictors and suggests the model still explains about 33.98% of the variance when adjusted for complexity.
- F-statistic (p-value < 2.2e-16): The overall model is highly statistically significant. This indicates that at least one of the independent variables is significantly related to the dependent variable.
Estimate column: This coefficient estimates indicate the direction and magnitude of the effect each predictor has on the response variable. A positive estimate suggests that increasing that variable is associated with an increase in the response, while a negative estimate suggests the opposite.
Pr(>|t|) column: This value represents the probability (0-1.0) that a predictor’s (independent variable) effect on the response variable (dependent variable, meters of horizontal error) could be explained by random chance. A low value (typically < 0.05 for statistical significance) in this column strongly suggests that a given predictor has an effect on the response variable.
Accordingly, X position within the image (imageSelectedProportionX), and pixelDistFromPrincipalPoint had a minor yet statistically-significant effect on calculation accuracy. This validates the assessment of the previous graph.
The far most influential predictors of horizontal error however proved to be horizontal distance from drone to target (drone_to_gcp_horizontal_distance), followed by slant angle (distance_ratio, calculated from drone_to_gcp_vertical_distance / drone_to_gcp_horizontal_distance).
Of these two, horizontal distance from drone to target is the most significant factor by far for accuracy according to the linear regression model. This has been confirmed in other tests using similar methodology.
Thunderstorm 24-2 Test and Demonstration at Fort Huachuca
Prior to July 2024, Theta Informatics applied for and was selected to demonstrate at the Thunderstorm 24-2 exercise organized by the Office of the Undersecretary of Defense, Research and Engineering, Innovation and Modernization [OUSD (R&E) I&M] at U.S. Army Fort Huachuca in Arizona:

https://sam.gov/opp/717545b12f2f4f589baa9e308edc00de/view
From the event’s description:
This event will concentrate on advancing the capabilities and/or capacities of Persistent Sensing technologies. Persistent Sensing enables the deployment of sensors capable of lingering on-demand in an area for the purpose of detecting, locating, characterizing, identifying, and tracking an object or area of interest and transferring the information in near- or real-time. Discovering and implementing the next generation of persistent sensing solutions ensures situational awareness to optimize DoD activities and protect the Warfighter, regardless of the threat or operating environment.
My firm’s belief is that OpenAthena’s terrain-raycast technique is a foundational technology which may be used for persistent remote sensing by sUAS. Our firm aims to integrate the technique with live UAS video feed and object detection AI to provide continuous, near-instantaneous situational awareness for critical remote sensing applications such as search and rescue, law enforcement, and defense. Testing and demonstration at this event was an important first step towards this goal.
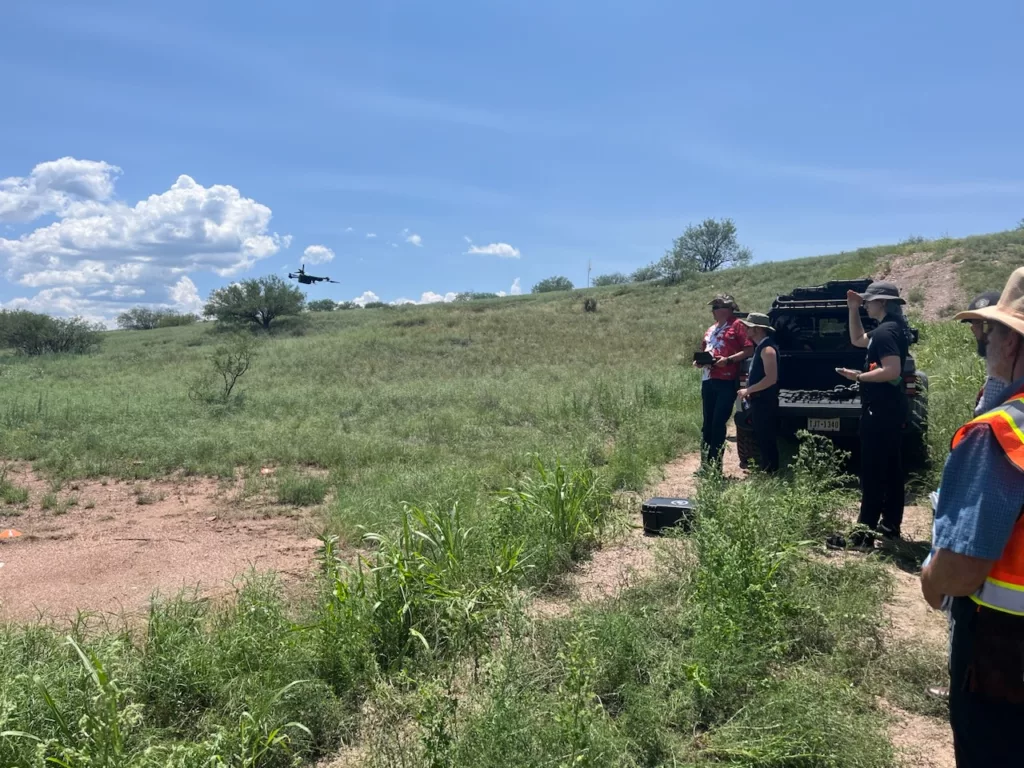
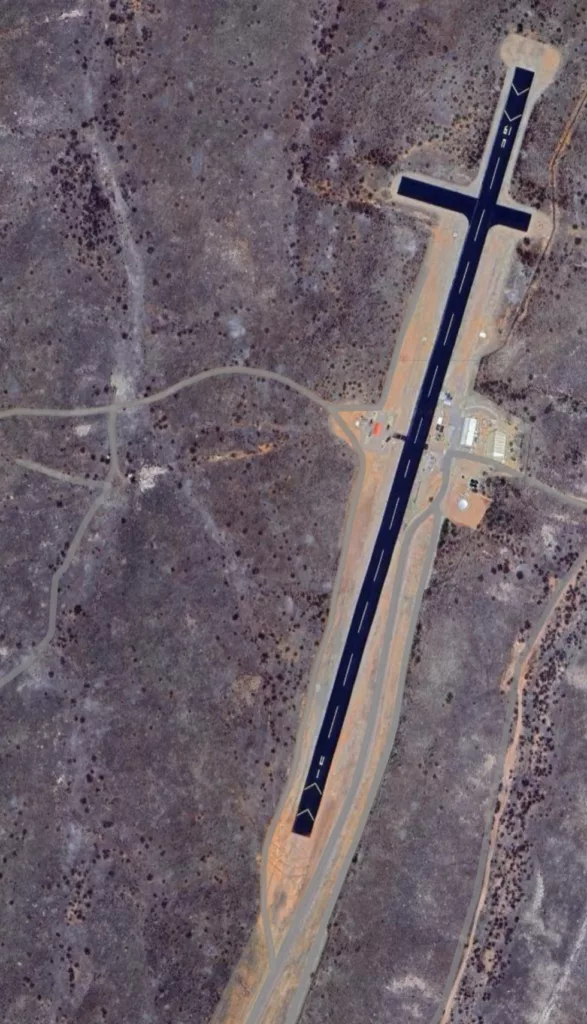
The event was conducted in the area around the Pioneer Runway at the western edge of Fort Huachuca:
I was greatly assisted in these efforts by Ty Audronis and his team with Tempest Droneworx™, who offered to fly and provide imagery from their Skydio X2D drone for the test. Assistance from staff the Penn State University Applied Physics Laboratory was also critical in this test; they provided significant logistical, material, and operational support. One volunteer helped me place and record over 50 ground control points over multiple hours in the hot Arizona sun (and later spend equal time removing them upon the conclusion of the test week).
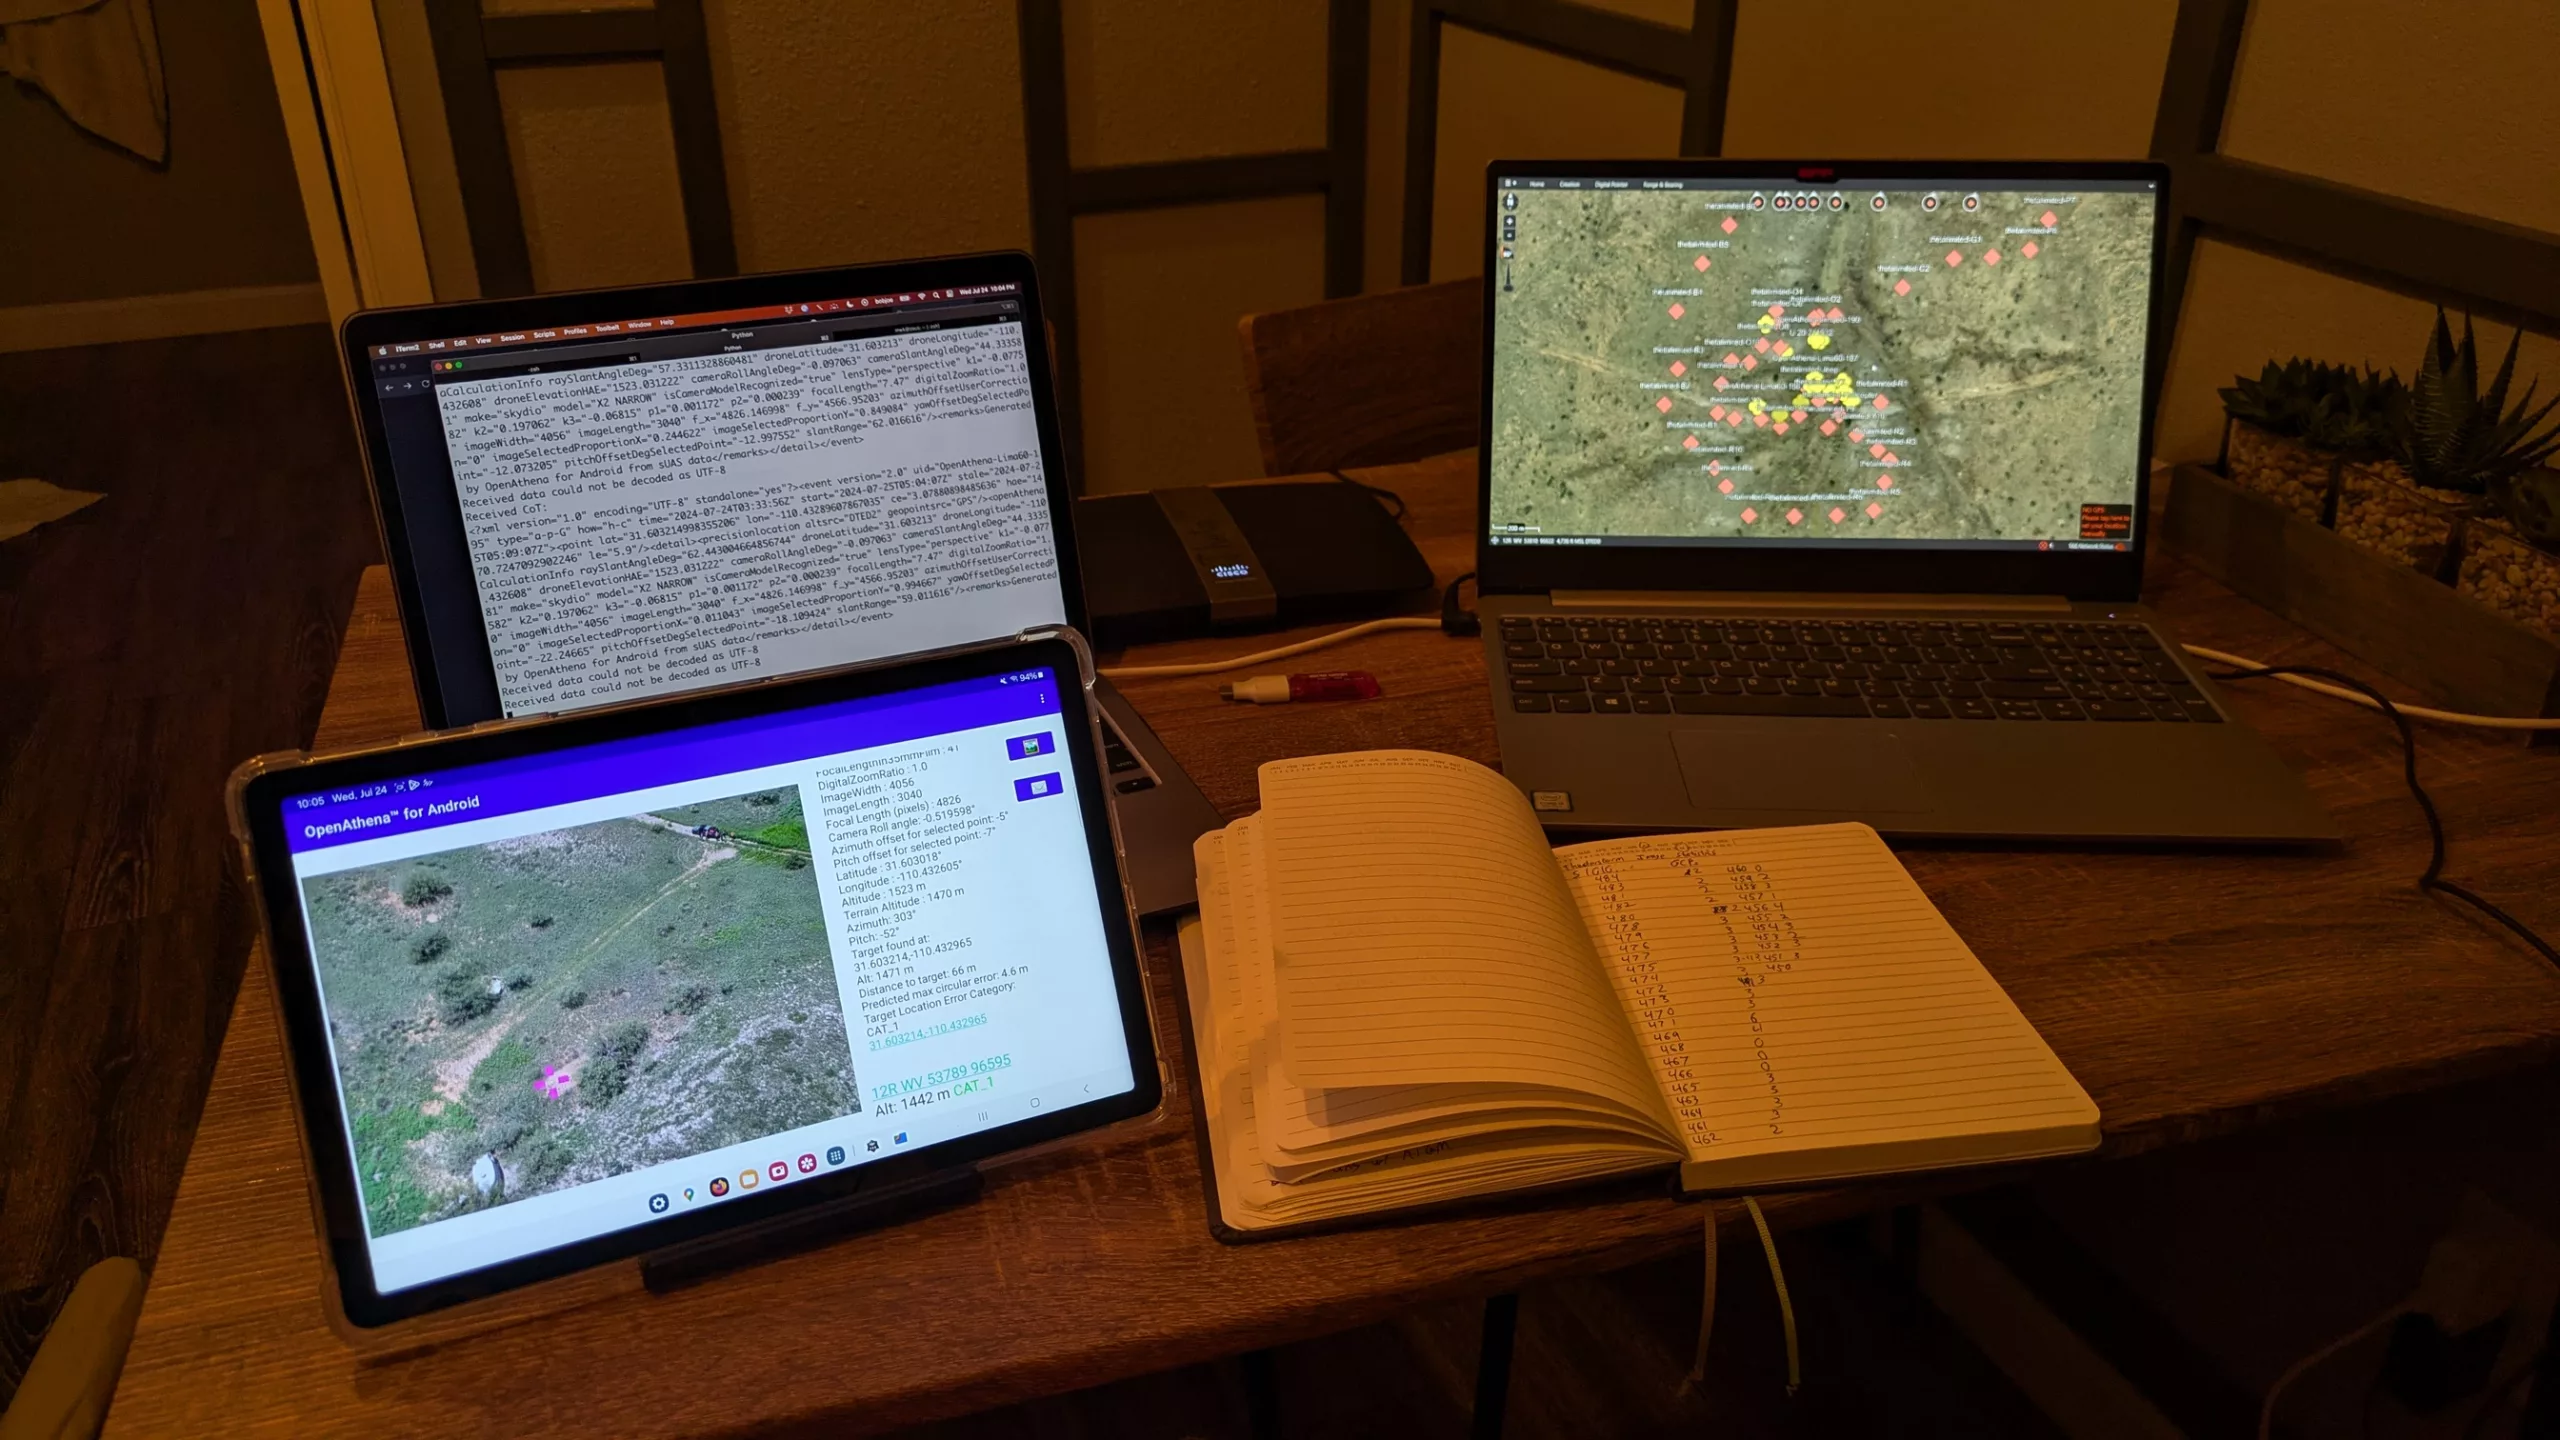
Working in the evenings, I used images from the drone to perform the experiment. I used a methodology almost identical to the East Roswell test, where Cursor on Target output from OpenAthena was recorded and analyzed against the recorded GCP locations using the OA Accuracy Testing Framework.
Results from Thunderstorm 24-2 Testing
Testing at Thunderstorm revealed the Skydio X2D system (experiment group) on the Blue UAS list provides inferior accuracy with OpenAthena compared to the DJI Mavic 2 Zoom (control group):
Sample size: n=441 calculations from 106 drone images
| Accuracy Statistic | Description | Value |
| CEP | 50th percentile of Circular Error | 7.73 meters |
| CE90 | 90th percentile of Circular Error | 17.3 meters |
| MAE | Mean Absolute Error | 9.05 meters |
Compared to the control group, the X2D had an increase in its CE90 statistic of over 44% of the control group. This was observed despite the significantly higher monetary cost of the experimental UAS (typically $20,000-$25,000) compared to the control UAS (MSRP of $1,249 in 2018, now as low as $300-$400 in the used aftermarket).
That being said, there were a few differences in methodology for the experiment and control group’s testing which may have influenced this result:
- The control group’s GCPs were placed within a small area on a flat baseball field, while the experiment group’s GCPs were placed over a larger area with more significant terrain variation
- The control group test was conducted near Atlanta, GA while the experiment group test was conducted near Sierra Vista, AZ. Vegetation and radar reflection characteristics for the NASA SRTM terrain elevation dataset may be different due to properties of each location’s biome and topology.
- The control group images were recorded while the drone was stationary and stabilized, while many of the experiment group’s images were taken during lateral movement orbiting around a fixed ground location.
- The experiment group used significantly more GCPs (53 vs. 7 for the control group). The ground stake for at least one GCP for the experiment group failed and the GCP was moved by wind. Another GCP was missing and could not be recovered at the end of the test. Both GCPs are believed to have been in an area unused for this test; however we cannot be certain this did not affect experiment results
- GCPs in the experiment group were much harder to spot compared to GCPs in the control group. This could have resulted in false positives during the test procedure, which would skew error figures higher.
These differences may explain some of the discrepancy in accuracy between the experiment and control group. It is likely however that the characteristics of each drone’s sensors had a more significant effect. Notably, compared to the DJI Mavic 2 Zoom (control group), the Skydio X2D does not have a magnetometer (compass sensor) and instead uses GPS displacement and feature tracking from a downward-facing camera to measure platform and camera orientation. My hypothesis is that the lack of a magnetometer may have produced inferior orientation measurements from the experiment UAS compared to the control group.
Overall, the experiment UAS produced calculations from OpenAthena inferior in accuracy compared to the control UAS regardless of horizontal distance or ray slant angle:


Additionally, despite the use of calibrated camera intrinsics parameters published by the experiment UAS’s manufacturer, position of the target within a given drone image appeared to have a more significant detrimental effect on calculation accuracy than the control UAS:
This suggests that either OpenAthena was not using these parameters correctly for its camera intrinsics modeling or the particular drone camera used differed from these published values.
The following is a linear regression model for the experiment group:
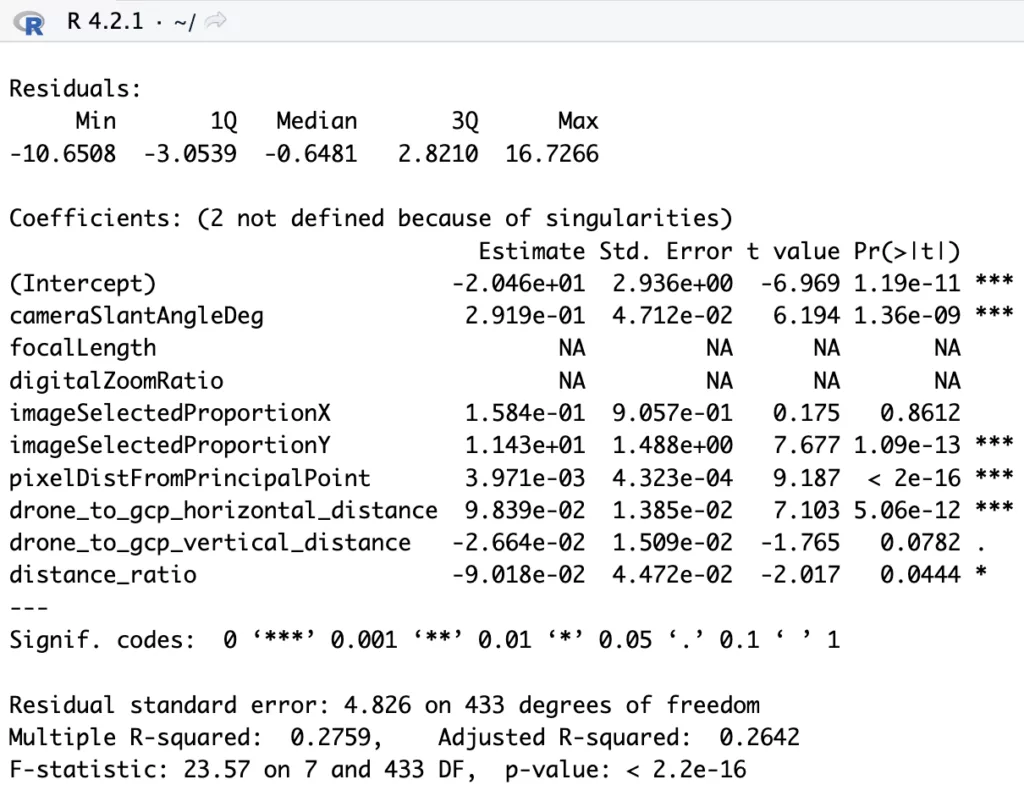
Overall Model Fit:
- Mavic 2 Zoom (Control): R² ≈ 0.354, Adjusted R² ≈ 0.340
- Skydio X2D (Experiment): R² ≈ 0.276, Adjusted R² ≈ 0.264
The control model (Mavic) explains a greater proportion of variance in the outcome than the experiment model (Skydio). While both models are statistically significant, the Mavic model has a somewhat stronger overall fit.
Differences in Significant Predictors:
Interestingly, the cameraSlantAngle in the experiment group’s model had a highly-significant (p = 1.36e-09) effect on calculation inaccuracy, while this factor was nearly completely irrelevant for the control group (p = 0.96596). This suggests that the pitch angle of the Skydio’s camera may be a significant source of error not present in the control group UAS. This is further reflected by the placement on the Y axis of the image (imageSelectedProportionY) having a strongly positive and significant (p = 1.09e-13) effect on accuracy for the experiment group while being insignificant for the control group.
In the control group (Mavic 2 Zoom), the coefficient for drone_to_gcp_horizontal_distance was around 0.246 meters per meter, meaning that for each meter increase in horizontal distance from the GCP, the horizontal error increased by about 0.246 units, all else equal.
In the experimental group (Skydio X2D), the coefficient was approximately 0.098 meters per meter, indicating that the same one-unit increase in horizontal distance from the GCP led to a smaller increase (about 0.098 units) in the horizontal error.
This result is surprising given the observed differences in significance of the cameraSlantAngle between the control and experimental groups. This may be explained by the control group test’s more effective camera stabilization+orientation measurement, leading horizontal distance to be a more significant predictor of horizontal error for its linear regression model compared to the experiment group.
Conclusion:
The test results indicate that OpenAthena’s novel terrain-raycast technique is viable for rapid remote location sensing from multiple sUAS platforms. The technology has significant disruptive potential in the military domain, where it may make the Forward Observer’s role significantly safer and more effective.
Results indicate that the gap in precision afforded by bespoke military sUAS platforms and inexpensive consumer-grade sUAS has narrowed significantly, and in some cases even been surpassed by commercial civilian UAS hardware. This is not even considering subjective factors such as reliability, ease of use, interoperability, and price point, which are arguably superior on consumer devices. This presents significant challenges to U.S. Armed Forces, who may be limited to use of low-volume production models on the DIU’s Blue UAS list regardless of platform quality, availability, or performance characteristics. In large scale combat operations (LSCO), at present rate and with current policies the U.S’s Armed forces may struggle to maintain sUAS capability for Forward Observation (FO) due to high attrition rates.
Attrition rates of sUAS platforms have been extremely high in the ongoing Ukraine war. The Armed Forces of Ukraine are estimated to lose 10,000 UAS per month to attrition, with each platform having an estimated average lifespan of less than a week. In 2023, Ukraine was buying 60% of DJI’s global output of Mavic quadcopter drones. If U.S. armed forces are called upon to conduct LSCO of a similar character in the near future, attrition may quickly deplete U.S. stocks of military sUAS platforms and leave forces significantly under-matched against an adversary using commercial sUAS hardware.
Military commanders should be educated on the characteristics of sUAS and their effectiveness in the Forward Observer role. For developing new techniques, tactics, and procedures (TTPs) for and against use of sUAS for FO, regular use in force-on-force training with such systems is needed.
The test results also demonstrate significant asymmetry in cost and sustainability of military sUAS against civilian platforms despite symmetry in operational outcomes (for terrain-raycast targeting and FO). This suggests that further effort should be made into the production of high-volume, low cost military sUAS with the performance characteristics necessary for use in the Forward Observer role via terrain-raycast.
The terrain-raycast technique may also be extremely useful for other time-sensitive tasks such as search and rescue, law enforcement, and security applications. This technology can save lives. Further testing of the technology by the scientific community would promote greater awareness, confidence, and trust necessary for widespread adoption of this technology for many life-saving applications.
For those wishing to replicate these experiments, the experimental methodology, analysis framework, and raw data are available via the GitHub repo below:
https://github.com/Theta-Limited/OA-Accuracy-Testing/tree/main
Theta Informatics LLC can be reached for question or comments at the following email: inquiries@theta.limited
Note: Views expressed in this article are solely those of Theta Informatics LLC. No representations are made as to endorsement or shared views among the mentioned cooperative parties.
Note on experiment results: after the above experiments, a bug was found in the library used by OpenAthena for converting between orthometric (from mean sea level) and ellipsoidal (height above the WGS84 reference ellipsoid) vertical datum. The nature of this bug caused target elevation values to be off by up to 60 meters but did not significantly effect horizontal coordinates used for this test. More detail on this issue is available below:
2025-01-15: Minor edits for readability and clarity